How I Made $10k Predicting Which Studies Will Replicate
Starting in August 2019 I took part in the Replication Markets project, a part of DARPA's SCORE program whose goal is to predict which social science papers will successfully replicate. I have previously written about my views on the replication crisis after reading 2500+ papers; in this post I will explain the details of forecasting, trading, and optimizing my strategy within the rules of the game.
The Setup
3000 papers were split up into 10 rounds of ~300 papers each. Every round began with one week of surveys, followed by two weeks of market trading, and then a one week break. The studies were sourced from all social science disciplines (economics, psychology, sociology, management, etc.) and were published between 2009 and 2018 (in other words, most of the sample came from the post-replication crisis era).
Only a subset of the papers will be replicated: ~100 papers were selected for a full replication, and another ~150 for a "data replication" in which the same methodology is applied to a different (but pre-existing) dataset.1 Out of the target 250 replications, only about 100 were completed by the time the prizes were paid out.
Surveys
The surveys included a link to the paper, a brief summary of the claim selected for replication, the methodology, and a few statistical values (sample size, effect size, test statistic values, p-value). We then had to answer three questions:
- What is the probability of the paper replicating?
- What proportion of other forecasters do you think will answer >50% to the first question?
- How plausible is the claim in general?
The papers were split up into batches of 10, and the top 4 scorers in each batch won awards of $80, $40, $20, and $20 for a total of $4,800 per survey round.
The exact scoring method was not revealed in order to prevent gaming the system, but after the competition ended the organizers wrote a technical blog post explaining the "surrogate scoring rule" approach. Since the replications were not completed yet, scoring predictions had to be done without reference to the "ground truth"; instead they generated a "surrogate outcome" based on all the survey answers and used that to score the predictions.2
Markets
Every user started each round with 1 point per claim (so typically 300).3 These points were the currency used to buy "shares" for every claim. Long share positions pay out if the paper replicates successfully and short positions pay out if it does not. Like a normal stock market, if you bought shares at a low price and the price went up, you could sell those shares for a profit.
The starting price of each claim was based on its p-value:
- p<.05: 30%
- p<.01: 40%
- p<.001: 80%
The market did not operate like a typical stock market (ie a continuous double auction); instead, they used Robin Hanson's Logarithmic Market Scoring Rule which allows users to trade without a counterparty.4 Effectively it works as an automated market maker, making it costlier to trade the more extreme the price: taking a claim from 50% to 51% was cheap, while taking it from 98% to 99% was very expensive. Without any order book depth, prices could be rather volatile as it didn't take much for a single person to significantly shift the price on a claim; this also created profitable trading opportunities.
The payout for the markets was about $14k per round, awarded in proportion to winning shares in the papers selected for replication. Given the target of 250 replications, that means about 8% of the claims would actually resolve. The small number of actually completed replications, however, caused some issues: round 9, for example, only had 2 (out of the target 25) replications actually pay out.
Early Steps - A Simple Model
I didn't take the first round very seriously, and I had a horrible flu during the second round, so I only really started playing in round 3. I remembered Tetlock writing that "it is impossible to find any domain in which humans clearly outperformed crude extrapolation algorithms, less still sophisticated statistical ones", so I decided to start with a statistical model to help me out.
This felt like a perfect occasion for a centaur approach (combining human judgment with a model), as there was plenty of quantitative data, but also lots of qualitative factors that are hard to model. For example, some papers with high p-values were nevertheless obviously going to replicate, due to how plausible the hypothesis was a priori.5
Luckily someone had already collected the relevant data and built a model.6 Altmejd et al. (2019) combine results from four different replication projects covering 131 replications (which they helpfully posted on OSF). Here are the features they used ranked by importance:

Their approach was fairly complex, however, and I wanted something simpler. On top of that I wanted to limit the number of variables I would have to collect for every paper, as I had to do 300 of them in a week—any factors that would be cumbersome to look up (eg the job title of each author) were discarded. I also transformed a bunch of the variables, for example replacing raw citation counts with log citations per year.
I ended up going with a logistic ridge regression (shrinkage tends to help with out-of-sample predictions). The Altmejd sample was limited in terms of the fields covered (they only had social/cognitive/econ), so I just pulled some parameter values out of my ass for the other fields—in retrospect they were not very good guesses.7
1 | cv.ridge <- cv.glmnet(as.matrix(mydata), y_class, alpha = 0, family = "binomial") |
| Parameter | Value |
|---|---|
| intercept | 0.40 |
| log # of pages | -0.26 |
| p value | -25.07 |
| log # of authors | -0.67 |
| % male authors | 0.90 |
| dummy for interaction effects | -0.77 |
| log citations per year | 0.37 |
| discipline: economics | 0.27 |
| discipline: social psychology | -0.77 |
| discipline: education | -0.40 |
| discipline: political science | 0.10 |
| discipline: sociology | -0.40 |
| discipline: marketing | 0.10 |
| discipline: orgbeh | 0.1 |
| discipline: criminology | -0.2 |
| discipline: other psychology | -0.2 |
This model was then implemented in a spreadsheet, so all I had to do was enter the data, and the prediction popped up:
1 | =exp(Intercept+ |
While my model had significant coefficients on # of authors, ratio male, and # of pages, these variables were not predictive of market prices in RM. Even the relation of citations to market prices was very weak. I think the market simply ignored any data it was not given directly, even if it was important. This gave me a bit of an edge, but also made evaluating the performance of the model more difficult as the market was systematically wrong in some ways.
Collecting the additional data needed for the model was fairly cumbersome: completing the surveys took ~140 seconds per paper when I was just doing it in my head, and ~210 seconds with the extra work of data entry. It also made the process significantly more boring.
Predictions
I will give a quick overview of the forecasting approach here; a full analysis will come in a future post, including a great new dataset I'm preparing that covers the methodology of replicated papers.
At the broadest level it comes down to: the prior, the probability of a false negative, and the probability of a false positive.8 One must consider these factors for both the original and the replication.9
What does that look like in practice? I started by reading the summary of the study on the RM website (which included the abstract, a description of the selected claim, sample size, p-value, and effect size). After that I skimmed the paper itself. If I didn't understand the methodology I checked the methods and/or conclusions, but the vast majority of papers were just straight regressions, ANOVAs, or SEMs. The most important information was almost always in the table with the main statistical results.
The factors I took into account, in rough order of importance:
- p-value. Try to find the actual p-value, they are often not reported. Many papers will just give stars for <.05 and <.01, but sometimes <.01 means 0.0000001! There's a shocking number of papers that only report coefficients and asterisks—no SEs, no CIs, no t-stats.
- Power. Ideally you'll do a proper power analysis, but I just eyeballed it.
- Plausibility. This is the most subjective part of the judgment and it can make an enormous difference. Some broad guidelines:
- People respond to incentives.
- Good things tend to be correlated with good things and negatively correlated with bad things.
- Subtle interventions do not have huge effects.
- Pre-registration. Huge plus. Ideally you want to check if the plan was actually followed.
- Interaction effect. They tend to be especially underpowered.
- Other research on the same/similar questions, tests, scales, methodologies—this can be difficult for non-specialists, but the track record of a theory or methodology is important. Beware publication bias.
- Methodology - RCT/RDD/DID good. IV depends, many are crap. Various natural-/quasi-experiments: some good, some bad (often hard to replicate). Lab experiments, neutral. Approaches that don't deal with causal identification depend heavily on prior plausibility.
- Robustness checks: how does the claim hold up across specifications, samples, experiments, etc.
- Signs of a fishing expedition/researcher degrees of freedom. If you see a gazillion potential outcome variables and that they picked the one that happened to have p<0.05, that's what we in the business call a "red flag". Look out for stuff like ad hoc quadratic terms.
- Suspiciously transformed variables. Continuous variables put into arbitrary bins are a classic p-hacking technique.
- General propensity for error/inconsistency in measurements. Fluffy variables or experiments involving wrangling 9 month old babies, for example.
Things that don't matter for replication but matter very much in the real world:
- Causal identification! The plausibility of a paper's causal identification strategy is generally orthogonal to its chances of replicating.
- Generalizability. Lab experiments are replicated in other labs.
Some papers were completely outside my understanding, and I didn't spend any time trying to understand them. Jargon-heavy cognitive science papers often fell into this category. I just gave a forecast close to the default and marked them as "low confidence" in my notes, then avoided trading them during the market round. On the other hand, sometimes I got the feeling that the jargon was just there to cover up bullshit (leadership studies, I'm looking at you) in which case I docked points for stuff I didn't understand. The epistemological problem of how to determine which jargon is legit and which is not, is left as an exercise to the reader.
Pour exemple
The data from Replication Markets are still embargoed, so I can't give you any real examples. Instead, I have selected a couple of papers that were not part of the project but are similar enough.
Ex. 1: Criminology
My first example is a criminology paper which purports to investigate the effect of parenting styles on criminal offending. Despite using causal language throughout, the paper has no causal identification strategy whatsoever. If criminologists had better GRE scores this nonsense would never have been published. The most relevant bits of the abstract:
The present study used path analyses and prospective, longitudinal data from a sample of 318 African American men to examine the effects of eight parenting styles on adult crime. Furthermore, we investigated the extent to which significant parenting effects are mediated by criminogenic schemas, negative emotions, peer affiliations, adult transitions, and involvement with the criminal justice system. Consonant with the study hypotheses, the results indicated that [...] parenting styles low on demandingness but high on responsiveness or corporal punishment were associated with a robust increase in risk for adult crime.
The selected claim is the effect of abusive parenting (the "abusive" parenting style involves "high corporal punishment" but low "demandingness" and "responsiveness") on offending; I have highlighted the outcome in the main regression table below. While the asterisks only say p<.01, the text below indicates that the p-value is actually <.001.
Make your own guess about the probability of replication and then scroll down to mine below.
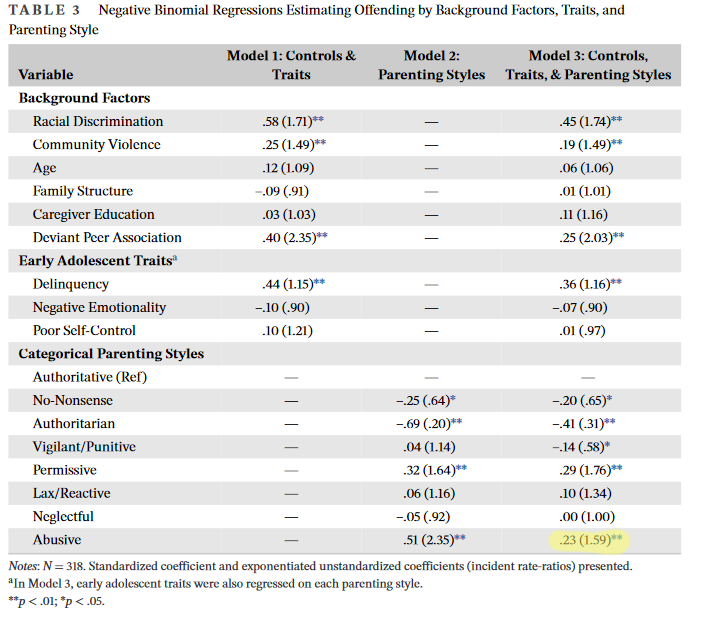
I'd give this claim 78%. The results are obviously confounded, but they're confounded in a way that is fairly intuitive, and we would expect the replication to be confounded in the exact same way. Abusive parents are clearly more likely to have kids who become criminals. Although they don't give us the exact t-stat, the p-value is very low. On the negative side the sample size (318 people spread over 8 different parenting styles) isn't that big, I'm a bit worried about variance in the classification of parenting styles, and there's a chance that the (non-causal) relation between abusive parenting and offending could be lost in the controls.
This is a classic example of "just because it replicates doesn't mean it's good", and also a prime example of why the entire field of criminology should be scrapped.
Ex. 2: Environmental Psychology
My second example is an "environmental psychology" paper about collective guilt and how people act in response to global warming.
The present research examines whether collective guilt for an ingroup’s collective greenhouse gas emissions mediates the effects of beliefs about the causes and effects of global warming on willingness to engage in mitigation behavior.
N=72 people responded to a survey after a manipulation, on a) the causes and b) the importance of the effects of climate change. The selected claim is that "participants in the human cause-minor effect condition reported more collective guilt than did participants in the other three conditions (b* = .50, p <.05)". Again, make your own guess before scrolling down.
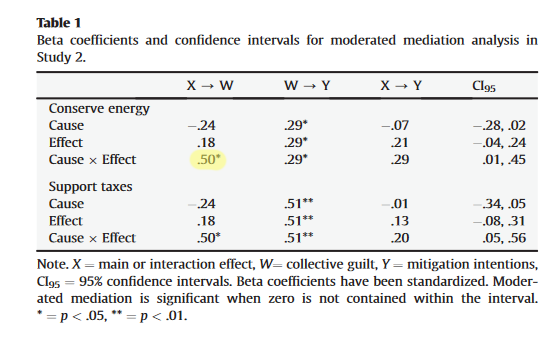
I'd go with 23% on this one. Large p-value, interaction effect, relatively small sample, and a result that does not seem all that plausible a priori. The lack of significance on the Cause/Effect parameters alone is also suspicious, as is the lack of signifiance on mitigation intentions. Lots of opportunities to find some significant effect here!
Spreadsheets
The worst part of Replication Markets was the user interface: it did not offer any way to keep track of one's survey answers, so in order to effectively navigate the market rounds I had to manually keep track of all the predictions. There was also no way to track changes in the value of one's shares, so again that had to be done manually in order to exit successful trades and find new opportunities. The initial solution was giant spreadsheets:
Since the initial prices were set depending on the claim's p-value, I knew ahead of time which claims would be most mispriced at the start of trading (and that's where the greatest opportunities were). So a second spreadsheet was used to track the best initial trades.11 The final column tracks how those trades worked out by the end of the market round; as you can see not all of them were successful (including some significant "overshoots"), but in general I had a good hit rate. As you can see, there were far more "longs" than "shorts" at the start: these were mostly results that were highly plausible a priori but had failed to get a p-value below 0.001.
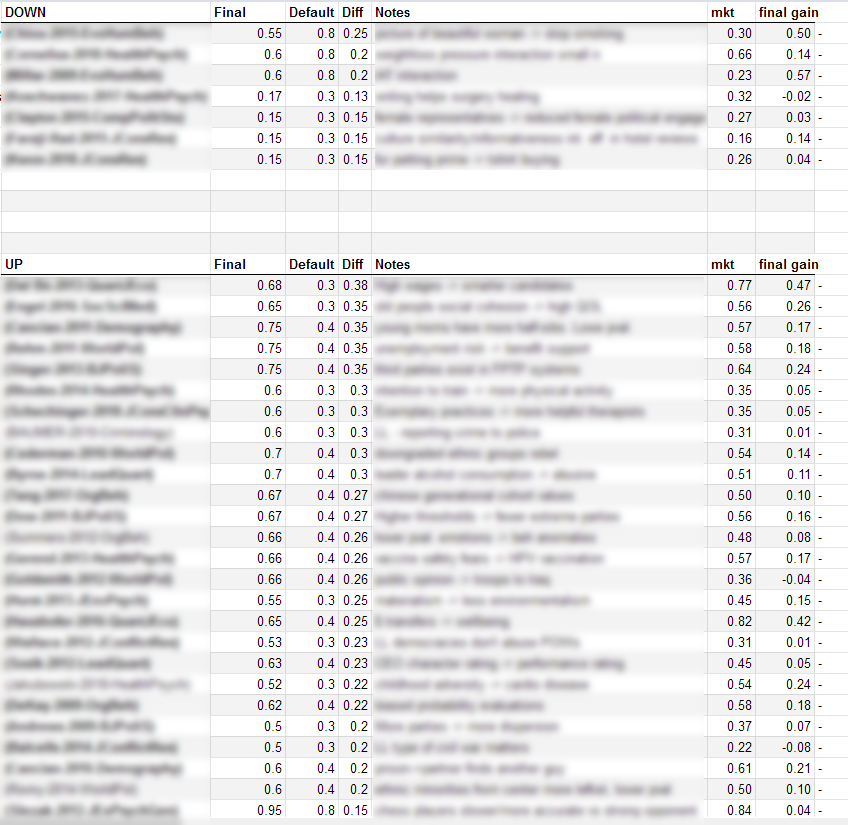
["Final" is my estimate, "default" is the starting price, "mkt" is the final market price]
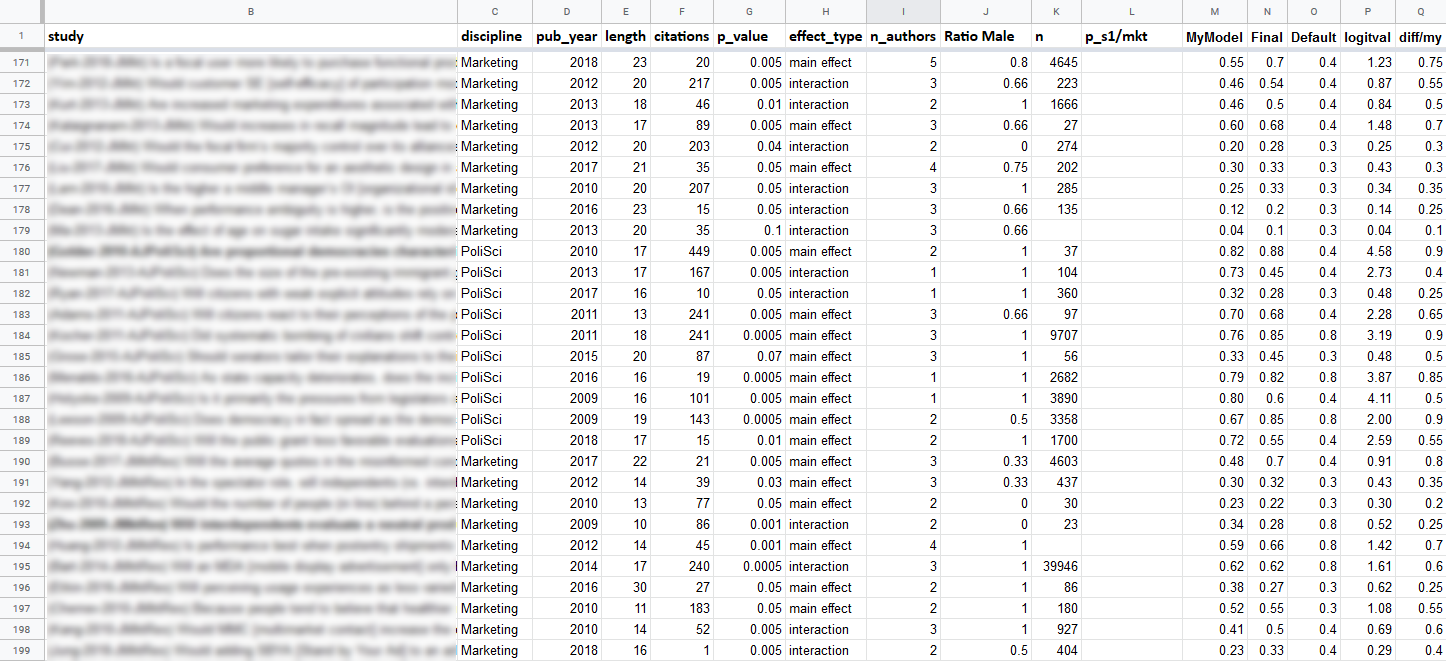
Finally, a third spreadsheet was used to track live trading during the market rounds. There was no clean way of getting the prices from the RM website to my sheet, so I copy/pasted everything, parsed it, and then inserted the values into the sheet. I usually did that a few times per day (more often at the start, since that was where most trading activity was concentrated). The claims were then ranked by the difference between my own estimate and the market. My current share positions were listed next to them so I knew what I needed to trade. The "Change" column listed the change in price since the last update, so I could easily spot big changes (which usually meant new trading opportunities).
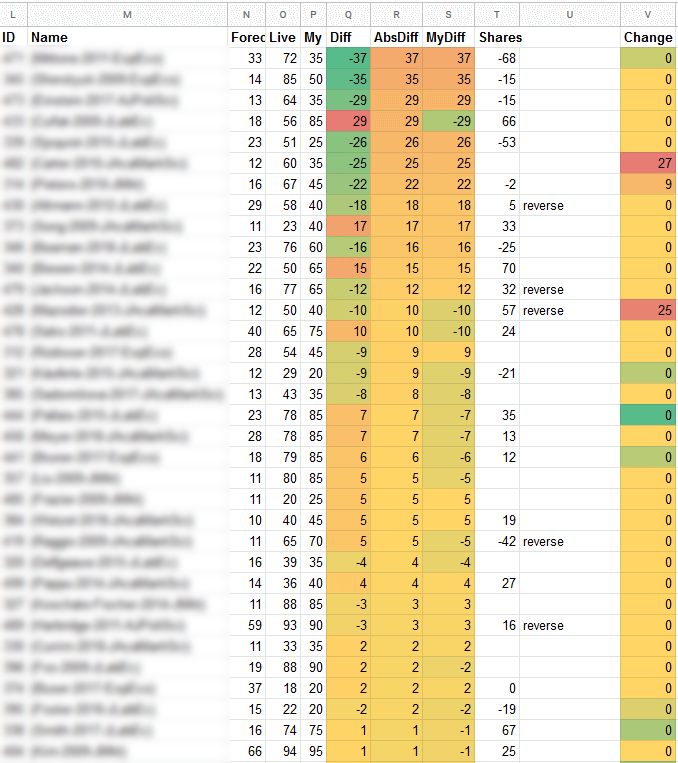
["Live" is the current market price, "My" is my estimate, "Shares" is the current position]
Forget the Model!
After the third round I took a look at the data to evaluate the model and there were two main problems:
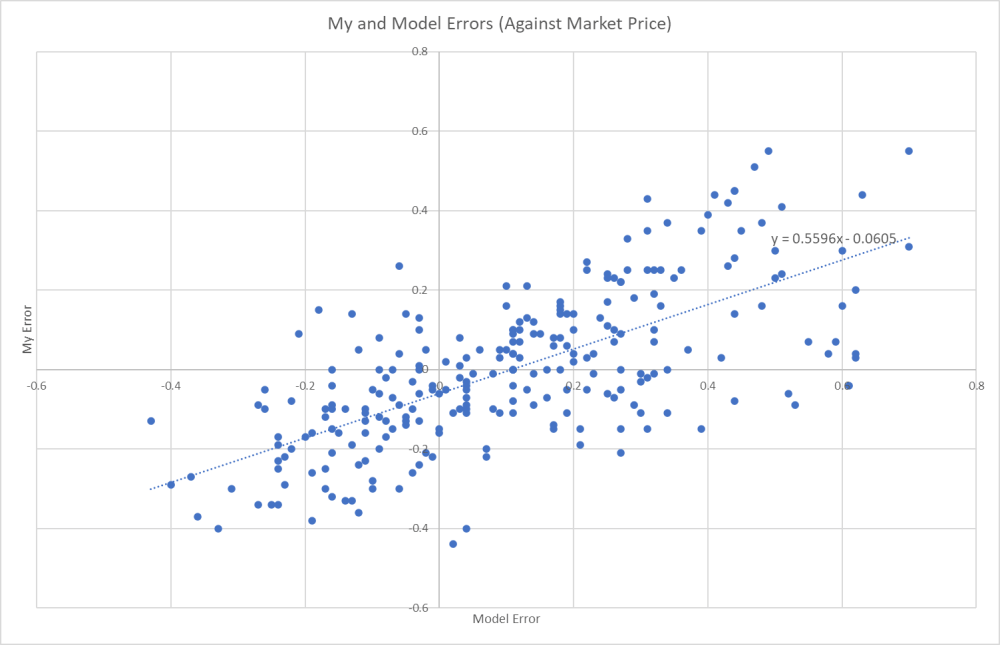
- My own errors (prediction minus market price) were very similar with the errors of the model:
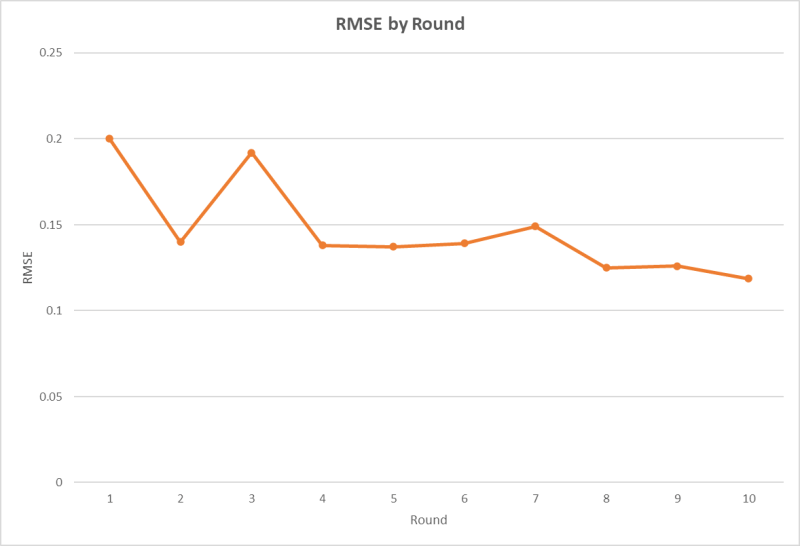
- The model failed badly at high-probability claims, and failed to improve overall performance. Here's the root mean square error vs market prices, grouped by p-value:
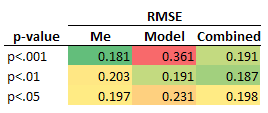
Of course what the model was actually trying to predict was replication, not the market price. But market prices were the only guide I had to go by (we didn't even get feedback on survey performance), and I believed the market was right and the model was wrong when it came to low-p-value claims.
What would happen if everyone tried to optimize for predicting market prices? I imagine we could have gotten into weird feedback loops, causing serious disconnects between market prices and actual replication probability. In practice I don't think that was an issue though.
If I had kept going with the model, I had some improvements in mind:
- Add some sort of non-linear p-value term (or go with z-scores instead).
- Quantify my subjective judgment of "plausibility" and add it as another variable in the model.
- Use the round 3 market data of 300 papers (possibly with extremized prices) to estimate a new model, which would more than triple my N from the original 131 papers. But I wasn't sure how to combine categorical data from the previous replications and probabilities from the prices in a single model.12
At this point it didn't seem worth the effort, especially given all the extra data collection work involved. So, from round 4 onward I abandoned the model completely and relied only on my own guesses.
Playing the Game
Two basic facts dictated the trading strategy:
- Only a small % of claims will actually be replicated and pay out.
- Most claims are approximately correctly priced.
It follows that smart traders make many trades, move the price by a small amount (the larger your trade the larger the price impact), and have a diversified portfolio. The inverse of this rule can be used to identify bad traders: anyone moving the price by a huge amount and concentrating their portfolio in a small number of bets is almost certainly a bad trader, and one can profitably fade their trades.
Another source of profitable trades was the start of the round. Many claims were highly mispriced, but making a profit depended on getting to them first, which was not always easy since everyone more or less wanted to make the same trades. Beyond that, I focused on simply allocating most of my points toward the most-mispriced claims.
I split the trading rounds into two phases:
Trading based on the expected price movement.
At the very end of the round, trading based on my actual estimate of replication probability.
Usually these two aspects would coincide, but there were certain types of claims that I believed were systematically mispriced by other market participants.13 Trading those in the hope of making profits during the market round didn't work out, so I only allocated points toward them at the end.
Another factor to take into consideration was that not all claims were equally likely to be selected for replication. In some cases it was pretty obvious that a paper would be difficult or impossible to replicate directly. I was happy to trade them, but by the end of the round I excluded them from the portfolio.14
Buying the most mispriced items also means you're stuck with a somewhat contrarian portfolio, which can be dangerous if you're wrong. Given the flat payout structure of the market, following the herd was not necessarily a bad idea. Sometimes if a claim traded strongly against my own forecast, I would lower the weight assigned to it or even avoid it completely. Suppose you think a study has a 30% chance of replicating, and a liquid market insists it has a 70% chance—how do you revise your forecast?
Reacting to Feedback
After every round I generated a bunch of graphs that were designed to help me understand the market and improve my own forecasts. This was complicated by the fact that there were no replication results—all I had to go by were the market prices, and they could be misleading.
Among other things, I compared means, standard deviations, and quartiles of my own predictions vs the market; looked at my means and RMSE grouped by p-value and discipline; plotted the distribution of forecasts, and error vs market price; etc.
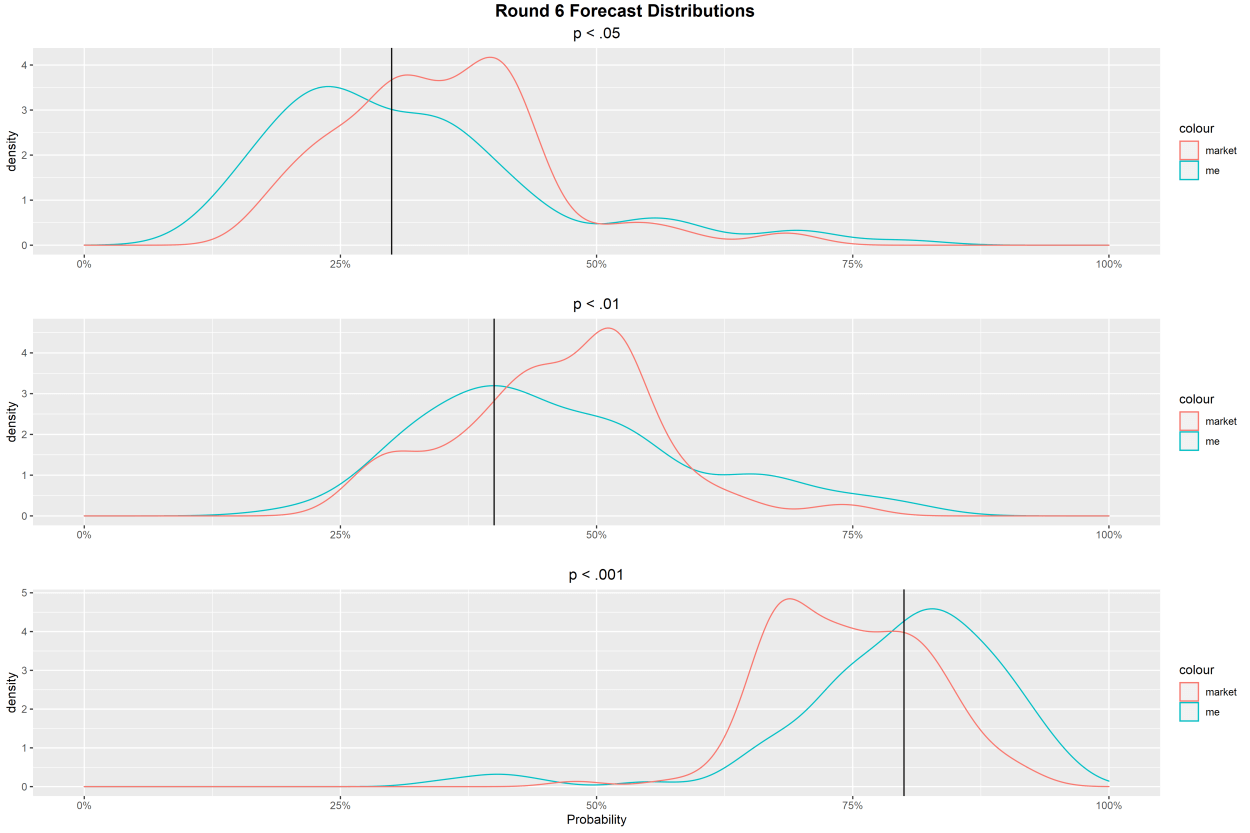
One standard pattern of prediction markets is that extremizing the market prediction makes it better. Simplistically, you can think of the market price being determined by informed traders and uninformed/noise traders. The latter pull the price toward the middle, so the best prediction is going to be (on average) more extreme than the market's. This is made worse in the case of Replication Markets because of the LMSR algorithm which makes shares much more expensive the closer you get to 0 or 100%. So you can often improve on things by just extremizing the market forecast, and I always checked to see if my predictions were on the extremizing side vs the market.
Here you can see the density plots of my own vs the market forecasts, split up by p-value category. (The vertical line is the default starting price for each group.)
And here's the same data in scatterplot form:
 My predictions vs the market.
  Difference between my forecasts and the market, by discipline. The market was more confident in results from economics, at least in round 3.
Over time my own predictions converged with the market. I'm not entirely sure how to interpret this trend. Perhaps I was influenced by the market and subtly changed my predictions based on what I saw. Did that make me more accurate or less? It's unclear, and based on the limited number of actual replication results it's impossible to tell. Another possibility is that the changing composition of forecasters over time made the market more similar to me?
Automated Trading
I think a lot of my success was due to putting in more effort than others were willing to. And by "putting in effort" I mean automating it so I don't have to put in any effort. In round 6 the trading API was introduced; at that point I dropped the spreadsheets and quickly threw together a desktop application (using C# & WPF) that utilized the API and included both automated and manual trading.15 Automating things also made more frequent data updates possible: instead of copy-pasting a giant webpage a few times a day, now everything updated automatically once every 15 minutes.
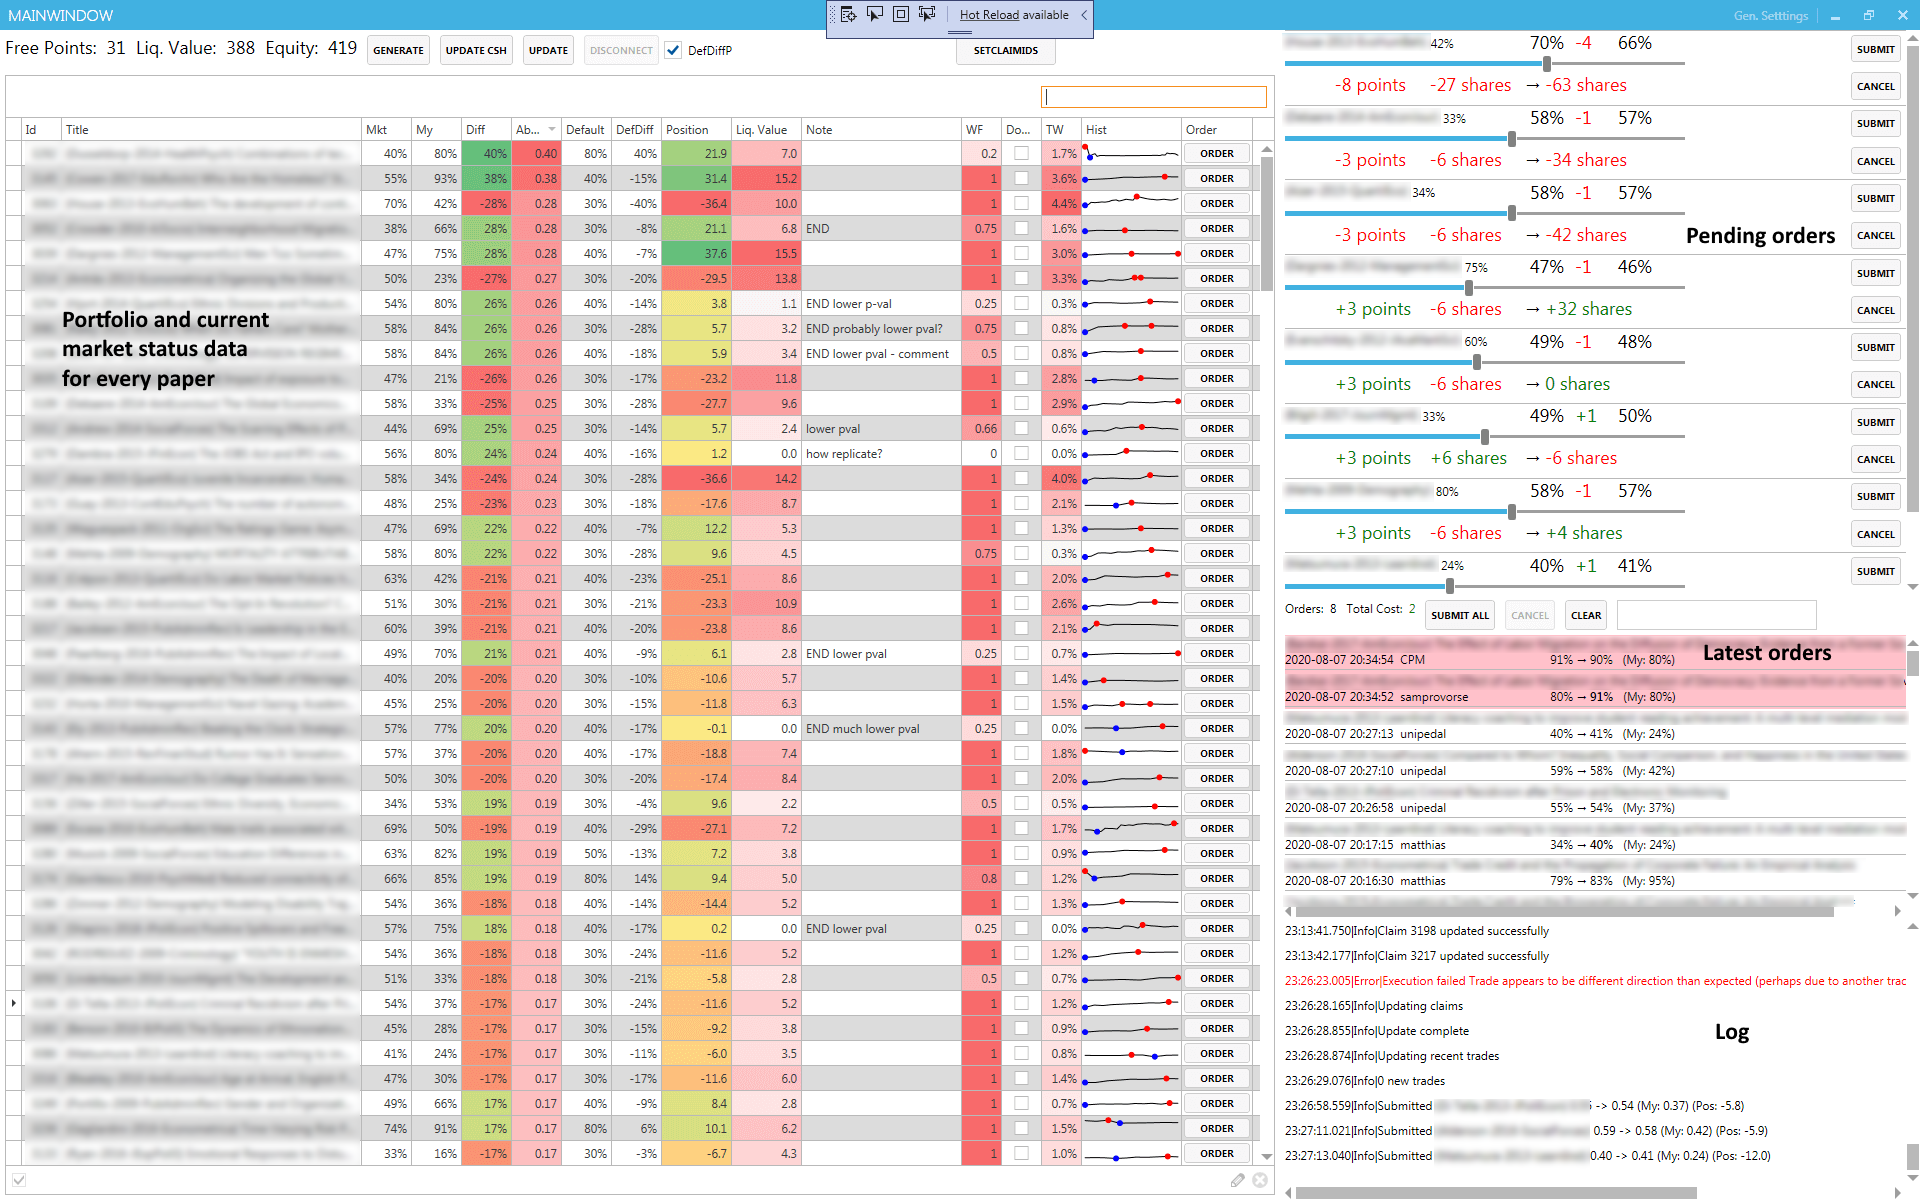
The main area on the left is the current state of the market and my portfolio, with papers sorted by how mispriced they are. Mkt is the current market price, My is my forecast, Position is the number of shares owned, Liq. Value is the number of points I could get by exiting this position, WF is a weight factor for the portfolio optimization, and Hist shows the price history of that claim.
On the right we have pending orders, a list of the latest orders executed on the market, plus logging on the bottom.
I used a simple weighting algorithm with a few heuristics sprinkled on top. Below you can see the settings for the weighting, plus a graph of the portfolio weights allocated by claim (the most-mispriced claims are on the left).
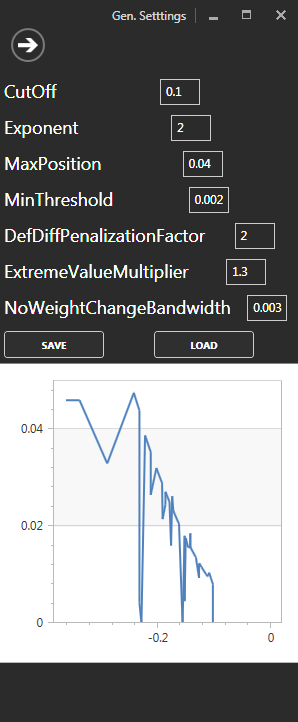
To start with I simply generated weights proportional to the square of the difference between the current market price and my target price (Exponent). Then,
- multiplied that by a per-study weight factor (WF in the main screen),
- multiplied that by ExtremeValueMultiplier for claims with extreme prices (<8% or >96%),
- removed any claims with a difference smaller than the CutOff,
- removed any claims with weight below MinThreshold,
- limited the maximum weight to MaxPosition,
- and disallowed any trading for claims that were already close to their target weight (NoWeightChangeBandwidth).
There was also another factor to take into consideration: the RM organizers ran some bots of their own. One simply traded randomly, while the other systematically moved prices back toward their default values. This created a predictable price pressure which had to be taken into account and potentially exploited: the DefDiffPenalizationFactor lowered the weight of claims that were expected to have adverse movements due to the bots.
Fading large price movements was automated, and I kept a certain amount of free points available so that I could take advantage of them quickly. Finally, turning the weighting algorithm into trades was fairly simple. If the free points fell below a threshold, the bot would automatically sell some shares. Most trades did not warrant a reaction however, and I had a semi-automated system for bringing the portfolio in line with the generated weights, which involved hitting a button to generate the orders and then firing them off.
High Frequency Trading
When there are a) obviously profitable trades to be made and b) multiple people competing for them, it's very easy to get into a competitive spiral that pushes speeds down to the minimum allowed by the available technology. That's how a replication prediction market ended up being all about shaving milliseconds off of trading algos.
By round 9 another player (named CPM) had also automated his trades and he was faster than me so he took all my profits by reacting to profitable opportunities before I could get my orders in—we were now locked in an HFT latency race. There was only one round left so I didn't want to spend too much time on it, but I did a small rewrite of my trading app so it could run on linux (thanks, .NET Core), which involved splitting it into a client (with the UI) and a server (with the trading logic), and patching in some networking so I could control it remotely.16 Then, I threw it up on my VPS which had lower ping to the RM servers.
When I first ran my autotrader, I polled the API for new trades once every 15 minutes17. Now it was a fight for milliseconds. Unfortunately placing the autotrader on the VPS wasn't enough, the latency was still fairly high and CPM crushed me again, though by a smaller margin this time. Sometimes I got lucky and snagged an opportunity before he could get to it though.
The Results
In money terms, I made $6640 from the surveys and $4020 from the markets for a total of $10,660 (out of a total prizepool of about $190k).
In terms of the actual replication results, the detailed outcomes are still embargoed, so we'll have to wait until next summer (at least) to get a look at them. Some broad stats can be shared however: the market predicted a 54% chance of replication on average—and 54% of the replications succeeded (the market isn't that good, it got lucky).
Of 107 claims that resolved, I have data on 31 which I made money on. For the rest I either had no shares, or had shares in the incorrect direction. Since I only have data on the successes, there's no way to judge my performance right now.
Survey vs Market Payouts
The survey round payout scheme was top-heavy, and small variations in performance resulted in large differences in winnings. The market payout on the other hand was more or less communistic. Everyone gets the same number of points; and it was difficult to either gain or lose too many of them in the two weeks of trading. As a result, the final distribution of prizes is rather flat. At best a good forecaster might increase earnings by ~10% by exploiting mispricings, plus a bit more through intelligent trading. The Gini coefficient of the survey payouts was 0.76, while the Gini of the market payouts was 0.63 (this is confounded by different participation levels, but you get the point).
This was backwards. I think one of the most important aspects of "ideal" prediction markets is that informed traders can compound their winnings, while uninformed traders go broke. The market mechanism works well because the feedback loop weeds out those who are consistently wrong. This element was completely missing in the RM project. I think the market payout scheme should have been top-heavy, and should have allowed for compounding across rounds, while the survey round should have been flatter in order to incentivize broader participation.
Conclusion
If the market had kept going, my next step would have been to use other people's trades to update my estimates. The idea was to look at their past trades to determine how good they were (based on the price movement following their trade), then use the magnitude of their trades to weigh their confidence in each trade, and finally incorporate that info in my own forecast. Overall it's fascinating how even a relatively simple market like this has tons of little nuances, exploitable regularities, and huge potential for modeling and trading strategies of all sorts.
In the end, are subsidized markets necessary for predicting replication? Probably not. The predictions will(?) be used to train our AI replacements, and I believe SCORE's other replication prediction project, repliCATS, successfully used (cheaper) discussion groups. It will be interesting to see how the two approaches compare. Tetlock's research shows that working as part of a team increases the accuracy of forecasters, so it wouldn't surprise me if repliCATS comes out ahead. A combination of teams (aided by ML) and markets would be the best, but at some point the marginal accuracy gains aren't really worth the extra effort and money.
I strongly believe that identifying reliable research is not the main problem in social science today. The real issue is making sure unreliable research is not produced in the first place, and if it is produced, to make sure it does not receive money and citations. And for that you have to change The Incentives.
PS. Shoot me an email if you're doing anything interesting and/or lucrative in forecasting.
PPS. CPM, rm_user, BradleyJBaker, or any other RM participant who wants to chat, hit me up!
- 1.For example a paper based on US GDP data might be "replicated" on German GDP data. ↩
- 2.The Bayesian Truth Serum answers do not appear to be used in the scoring? ↩
- 3.There were also some bonus points for continuous participation over multiple rounds. ↩
- 4.There would be significant liquidity problems with a continuous double auction market. ↩
- 5.I can't provide any specific examples until the embargo is lifted, sometime next year. ↩
- 6.Cowen's Second Law! ↩
- 7.If page count/# authors/% male variables are actually predictive, I suspect it's mostly as a proxy for discipline and/or journal. I haven't quantified it, but subjectively I felt there were large and consistent differences between fields. ↩
- 8.The RM replications followed a somewhat complicated protocol: first, a replication with "90% power to detect 75% of the original effect size at the 5% level. If that fails, additional data will be collected to reach "90% power to detect 50% of the original effect size at the 5% level". ↩
- 9.Scroll down to "Reconstruction of the Prior and Posterior Probabilities p0, p1, and p2 from the Market Price" in Dreber et al. 2015 for some equations. ↩
- 10.In fact it's a lot lower than the .001 threshold they give. ↩
- 11.In order to trade quickly at the start, I opened a tab for each claim. When the market opened, I refreshed them all and quickly put in the orders. ↩
- 12.I still haven't looked into it, any suggestions? Could just estimate two different models and weighted average the coefficients - caveman statistics. ↩
- 13.Behavioral genetics papers for example were undervalued by the market. Also claims where the displayed p-value was inaccurate - most people wouldn't delve into the paper and calculate the p-value, they just trusted the info given on the RM interface. ↩
- 14.Another factor to take into consideration was that claims with more shares outstanding had lower expected value, especially during the first five rounds when only ~10 claims per round would pay out. The more winning shares on a claim, the less $ per share would be paid out (assuming the claim is replicated). At the end of the round I traded out of busy claims and into ignored ones in order to maximize my returns. After round 5 the number of claims selected for replication per round increased a lot, making this mostly irrelevant. Or so i thought: this actually turned out to be quite important since only a handful of replications were actually completed for each round. ↩
- 15.The code is pretty ugly so I'm probably not going to release it. ↩
- 16.A basic familiarity with network programming is an invaluable tool for every forecaster's toolkit. ↩
- 17.The API had no websockets or long polling, so I had to poll the server for new trades all the time. ↩